
A company that is already working with appropriate marketing strategies has several goals to meet. It has to maximize revenue, promote branding among customers, and reduce the costs of production as well. However, with so many things to track, it becomes tough to keep up with the numbers regularly. Even if a brand maintains the data, the next step is to depict the patterns of customer behavior and market trends as well.
But that’s easier said than done. This is where customer success metrics come in and help in preparing productive data. Even so, there are close to 20 customer success metrics. And if you decide to keep track of all of them, you are doing nothing better than before. But that’s just the problem we are aware of.
Read this article to get to know the top customer success metrics for successful brands that are going to be helpful in the long run.
Top customer success metrics for successful brands
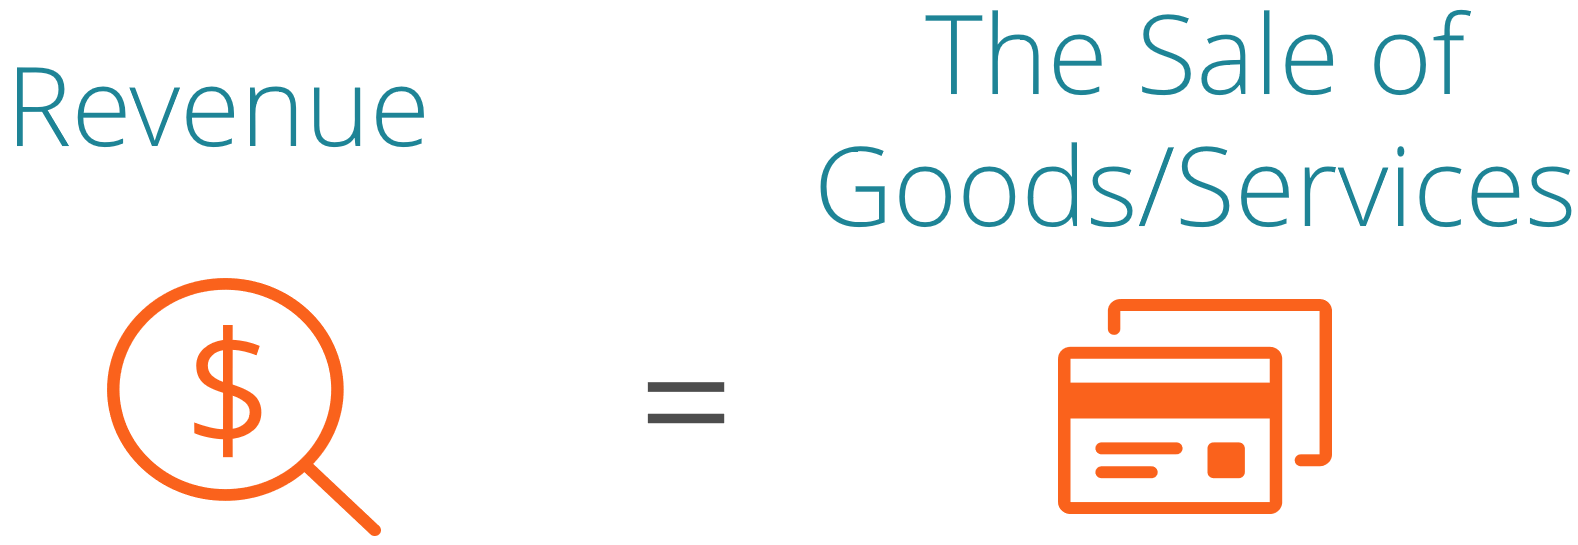
Average Revenue Per Account (ARPA)
This number tells how much revenue a company has generated for every customer who has created an account with it. It is usually measured in months or years, depending on the interpretation of data and expenses.
This customer success metric is important to analyze how popular the different products are among the customers and, hence, useful to the company. Since it monitors account-level activity, it is among the few metrics that deliver unit-level data.
Calculate the average revenue per account as follows:
ARPA = Monthly recurring revenue; over a defined period of time
Total number of customers
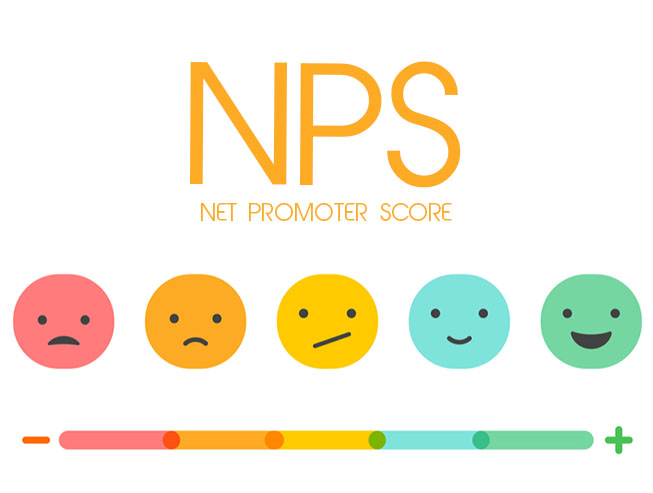
Net Promoter Score (NPS)
This number depicts how likely a customer is to promote your brand or service among their network. This number is also a reflection of the association between the brand and the customer. It usually ranges from -100 to 100.
It emphasizes how important it is to focus on customer satisfaction. To improve this value, it is necessary to provide timely support and reliable help to customers and improve their perception of the organization.
Once you have the data indicating how a brand actually performs on the ground, it will give a clear picture of why a customer chooses to promote your brand or not.
Calculate the net promoter score as follows:
To calculate NPS, it is important to collect feedback from users on a numeric scale, preferably 0-10. Once that is done, you need to categorize them as shown below:
✅ 9-10: Promoters of the brand
✅ 7-8: Passives of the brand
✅ 0-6: Detractors
Now, calculate the percentage of customers for each category. Lastly, NPS = Percentage of Promoters -Percentage of Detractors
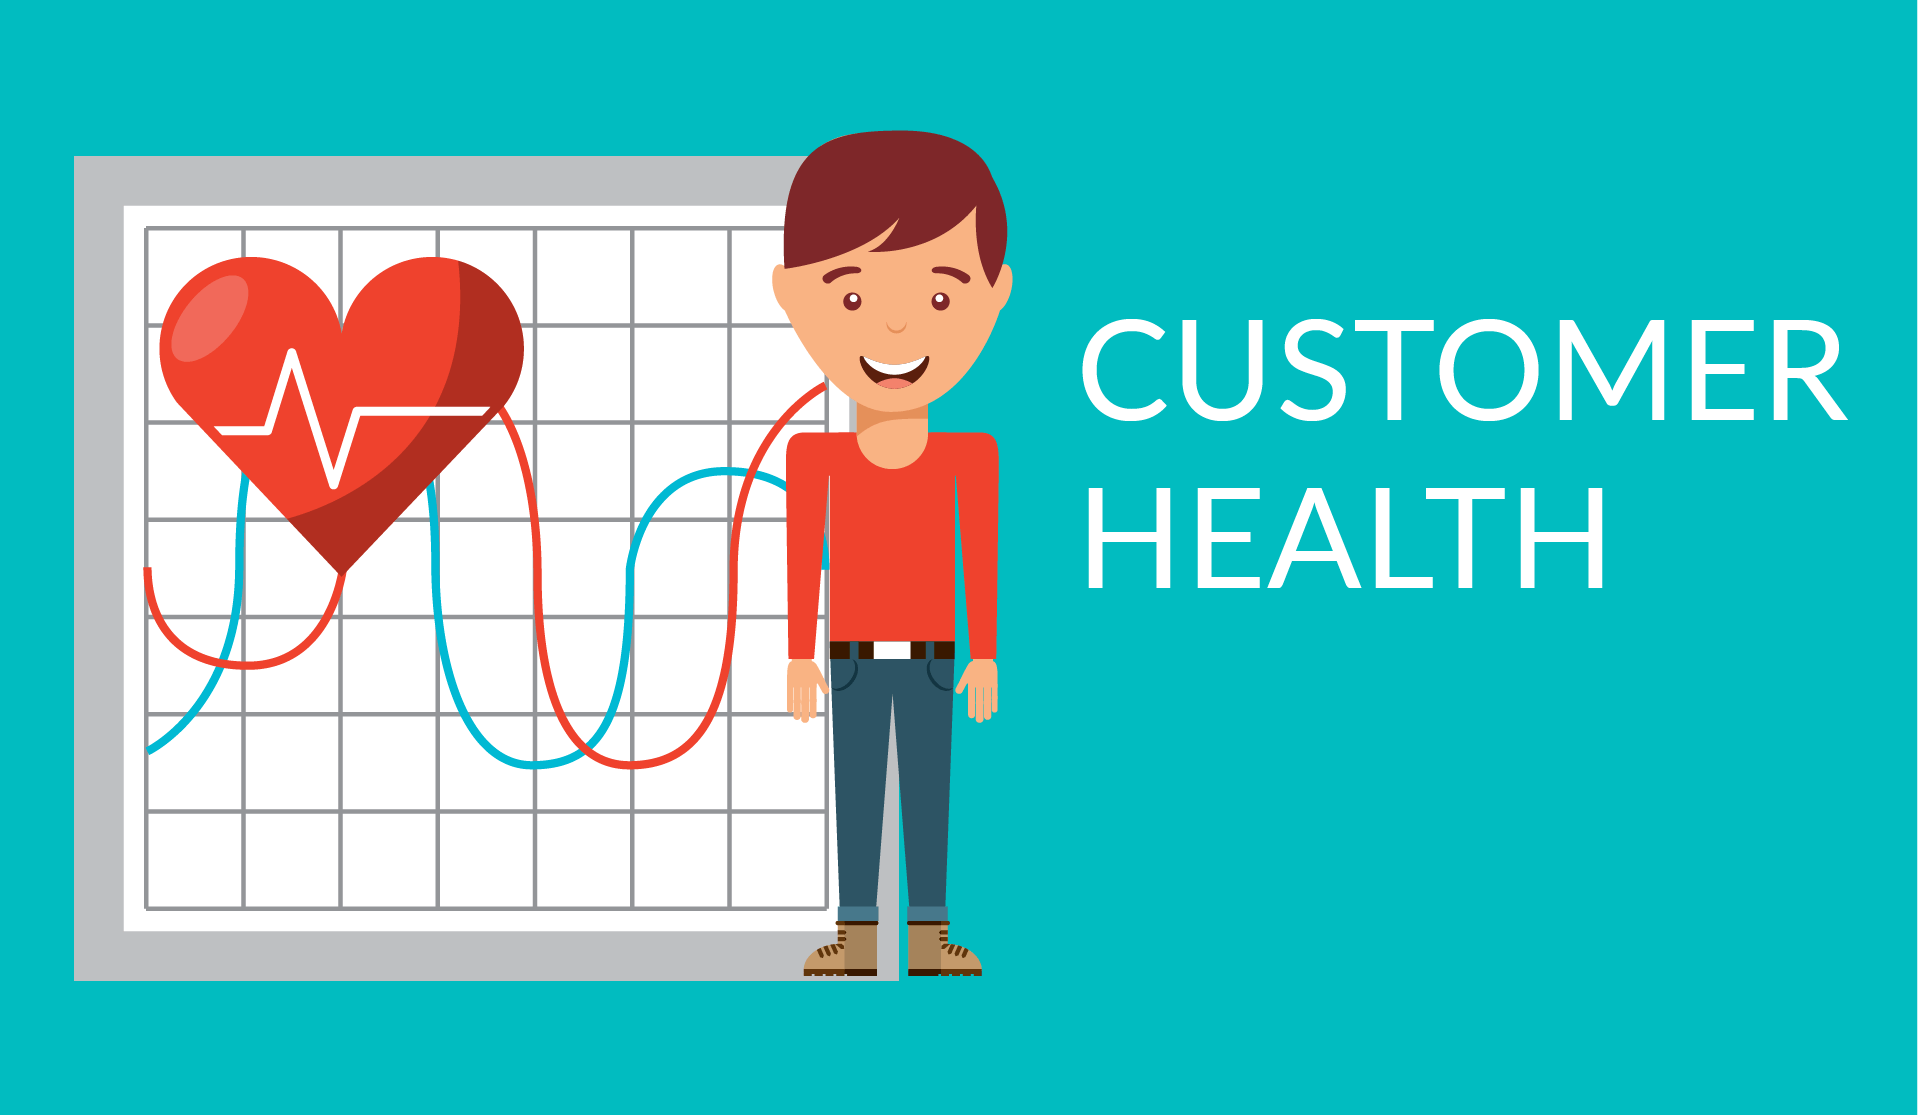
Customer Health Score (CHS)
The customer health score is a representation of how useful the service is to the user. The journey starts after a buyer has made a purchase of an item or product from you.
Your team needs to find out the answer to this: Is the customer using your product after the purchase? How has the experience been so far? Does the product add value as the customer had expected? Does it serve any other businesses apart from the ones the company proposed?
Therefore, the customer service teams need to connect with the buyers repeatedly. They need to maintain the relationship with the client, collect the data, and improve the services as well as the products.
Calculate CHS as follows:
Well, there isn’t any specific formula to check the health score of a company’s customers. The reason is that every product and service is unique, and hence, the parameters of judgment are specific to it. While all the data needs to be collected over time, different indexing tools can be utilized to come up with the health score. But you can use three steps: 1) Define user personas, segmentation, and metrics. 2) Determine the distribution of each person’s health score. 3)Determine the effect of each individual health score on the overall health score.
Customer Churn Rate (CCR)
This metric is an indication of how long the customers are loyal to your brand. Let’s take an example where your company offers a product on a monthly or yearly subscription. So, if you can collect how many customers leave the subscription over a period of time, that would be an indication of your churn rate.
It can also be measured by how long a customer has maintained an account with your company. It can be measured using a banking account, a gaming account, or even based on whether they continue to renew a subscription or not. It is a simple yet powerful branding metric that indicates customer attrition.
Calculate CCR as follows:
CCR = Number of customers leaving at the end of the interval
Number of customers at the beginning of the interval

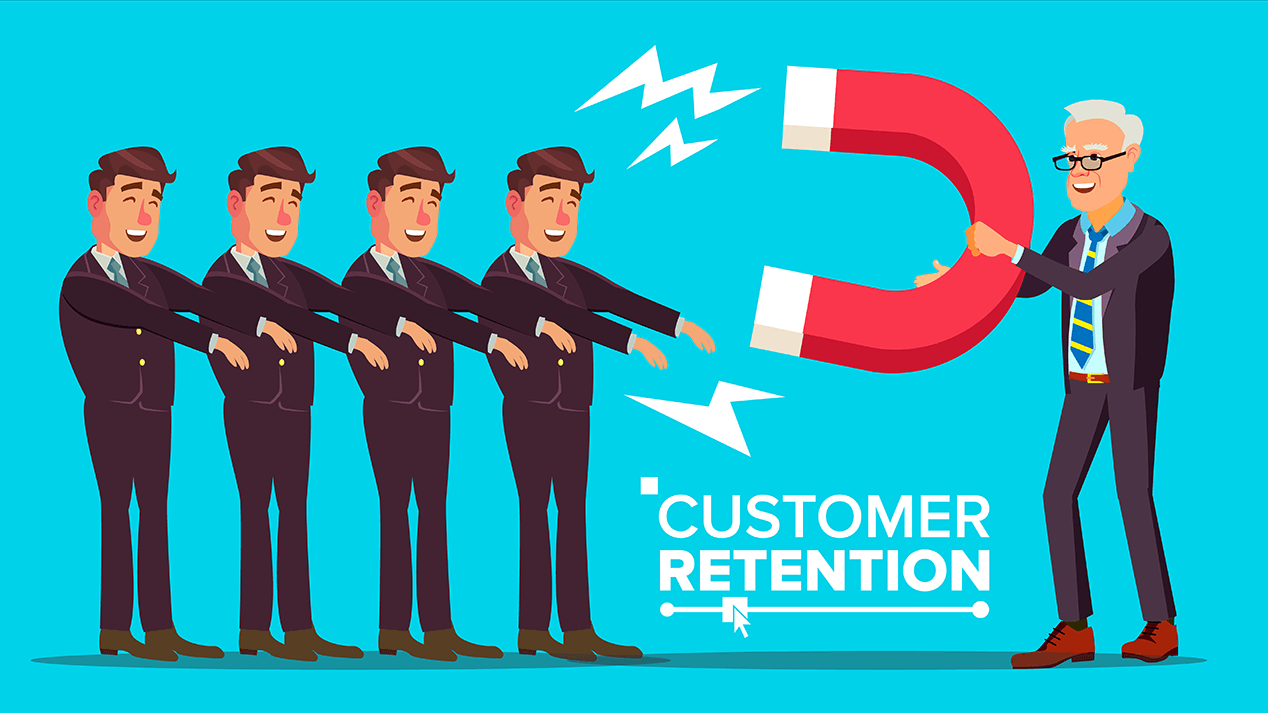
Customer Retention Cost (CRC)
The company incurs some costs for every lead converted into a customer. However, the deal doesn’t really close once the client makes a purchase. Even after that, the marketing department wants to retain that customer for as long as possible. And this is the customer retention cost.
This customer success metric is a fine reflection of how the company should optimize its spending to retain customers in the long run. Or what new initiatives could be incorporated into the allocated budget to retain them? Either way, it is important to know where these costs currently stand.
Calculate CRC as follows:
To calculate this cost, you need to take into account all the aspects that play a role in achieving the goal. It includes customer marketing costs, services and training costs, new engagement programs, account management costs, and customer success team costs.
CRC = Cost of (customer marketing + services and training + engagement programs + account management costs + customer success team costs)
To get the CRC per customer, divide the above sum by the number of active customers.
Customer Satisfaction Score (CSAT)
As the name suggests, with this metric, the goal is to identify customer satisfaction among customers and eventually improve branding.
The distinguishing fact is that instead of focusing on the entire journey with the customer, this metric focuses on individual interactive steps taken during the journey. For instance, how was the booking experience, how was the valet experience, and most commonly, what was the satisfaction rate of interaction with the customer support?
Since we are measuring effectiveness at every step, we need to come up with a strategy to collect feedback in the shortest possible time. This can further be utilized to devise an interactive marketing strategy or to improve the existing one.
Calculate CSAT as follows:
CSAT = 100 x Number of positive responses at an interaction
The total number of responses recorded
Customer Lifetime Value (CLV)
Another top customer success metric is the customer lifetime value. This number suggests how much revenue a single customer can bring to the table for the time they are associated with the company.
This applies to all businesses and their products. If this number increases from the current score, it is an indication that the services are actively being used by the customer. However, if the number decreases, then it is a clear indication that there’s room for improvement with a particular product or service offered.
Calculate CLV as follows:
To calculate this metric, you need to have the following ready:
✅ The average purchase value of the customer – A
✅ The average purchase frequency rate of the customer – B
✅ Average customer lifespan – C
Now CLV is the multiplication of the above 3: A X B X C. With this, you have an estimate of how much this or any customer can contribute to revenue.

Monthly Recurring Rate (MRR)
If you or your marketing team needs to keep a tap on how actively your customers are using the services offered during a month, then this is the best metric.
In this, the calculation starts from the point the purchase is made and is then tracked on a monthly basis. This number tells you how much your customers are spending each month on the service that your brand offers. It can be a great customer success metric to use over time, wherein you can track whether the spending has increased or decreased as compared to the previous data.
Over time, it can also help in predicting if a particular month records the highest or lowest sales for a particular product. One could also say this is one way to measure customer loyalty for the services and branding strategies.
Calculate MRR as follows:
MMR = number of active customers in a month X average revenue per user

Conclusion
With the evolving marketing strategies to generate more revenue, it is important to take note of what works well and when. With these best customer success metrics at hand, the workload for interpreting the effectiveness of these methods can be heavily reduced. Also, they can be helpful in displaying patterns among the different customers. Do use these and track the growth of your business in constructive calculations.
Tags: Analytics, customer analytics, Customer Churn Rate, Customer Health Score, Customer Lifetime Value, Customer Metrics, Customer Retention, Customer Retention Cost, Customer Satisfaction, Customer Satisfaction Score, Data Analytics, Monthly Recurring Rate, Net Promoter Score, Revenue Analytics